by
by 
We asked a data scientist to analyze the political voting patterns concerning the Covid-19 vaccination rate. The results were interesting in that they reflect a divided nation even during a deadly pandemic.
In a nutshell, it appears that the news and political websites that a person consumes seem to indicate if they will seek out and receive a COVID-19 vaccination. The following description is one analysis of the pure data of current and projected COVID-19 vaccination compared to a state’s voting record.
Table of Contents
Vaccination Rate Comparisons By State
Covid Analysis for the week of 10/11/21. I updated the political leanings of each state by including separate state house of representatives and state senate count either way. A few states ended up neutral by using this approach ( New Hampshire, Arizona & Pennsylvania). Wisconsin swung to the Republican side but just barely, and Michigan is on the Democratic side but just barely.
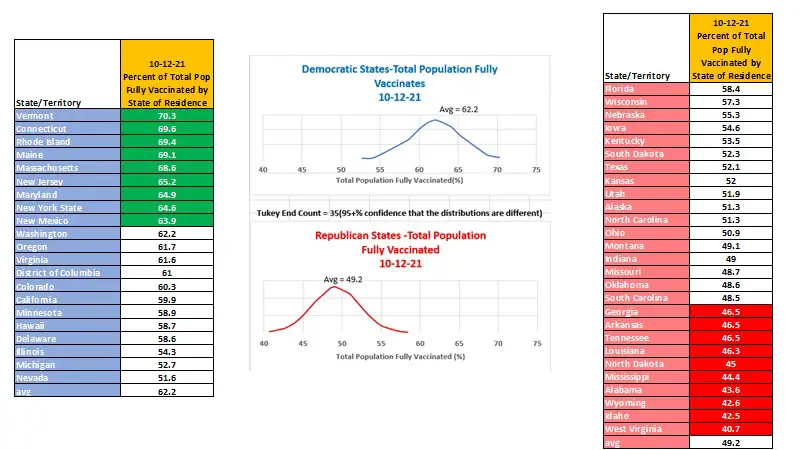
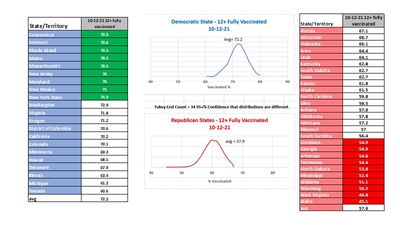
Democrat vs. Republication State Vaccination Rate for Entire Population
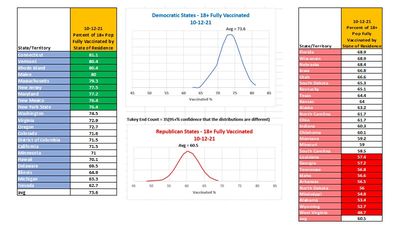
Adult Vaccination Rate Comparisons
The 2nd chart depicts this detail. Missouri, while not well vaccinated, is seeing quite a decline in the death rate this week. On the other hand, Oregon’s death rate climbed quite a bit this week. I suspect that’s bleed over from Idaho since it’s a hot mess.
Democrat vs. Republication State Full Vaccination Rate for Adults 18+
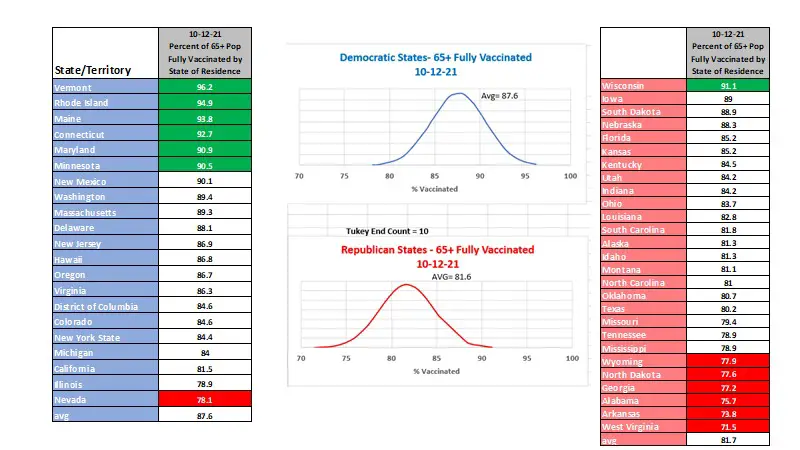
Democrat vs. Republication State Full Vaccination Rate for Adults 65+
Democrat vs. Republication State Full Vaccination Rate for Ages 12+
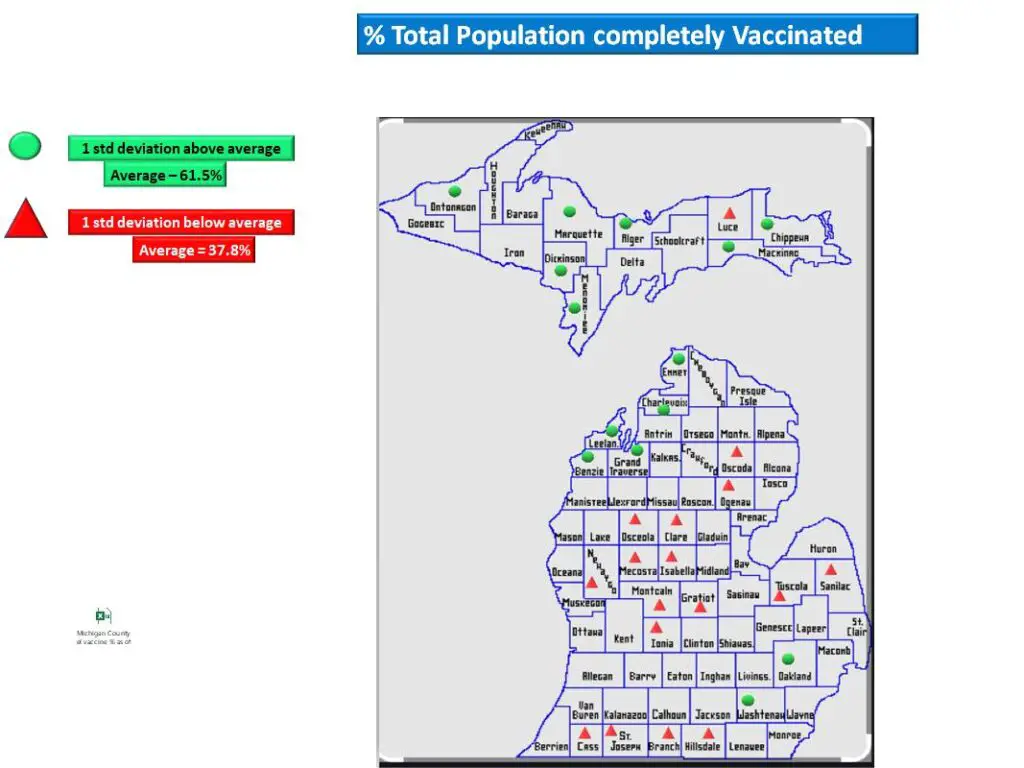
Michigan Vaccination Rates
Michigan (52.7%) & Nevada(51.6%) are the worst vaccinated democratic states. With cold weather coming, this makes them vulnerable.
Since I live in Michigan, I was curious about the county’s vaccine rates. The 3rd image is the map with the best/worst counties. Only two counties in SE Michigan are well vaccinated.
Vaccination Rates vs. Death
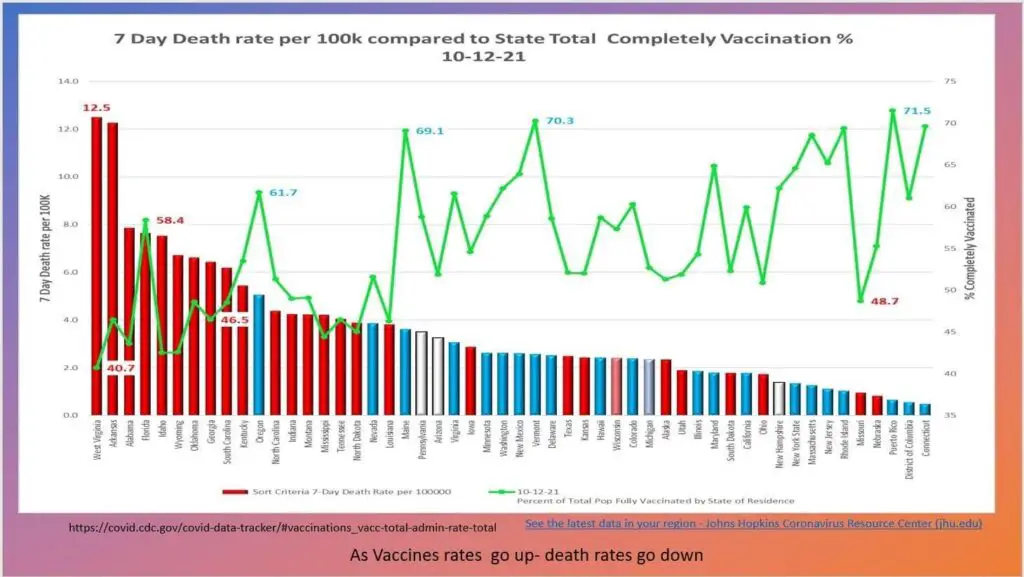
West Virginia(40.7) and Idaho(42.5) are the worst vaccinated Republican states, and their death rates show it.
Florida is well vaccinated, but its death rate is still very high. So I hypothesize that the snowbirds are in their vaccine rates, and since they went to their home states, Florida’s vaccine rate is much worse.
Test Positivity is a concern in several states:
- Idaho- 56.5%
- Oklahoma – 59.2%
- Nevada – 23.3%
- Iowa – 43.8%
- Kansas – 31.5%
The Quick Analysis
The quick and dirty hypothesis test I’ve run is the Tukey End Count test. It’s sorting a distribution from best to worst & getting a count from each end to determine if one distribution(D)’s is different from the other distribution(R’s). So If I sorted Best to Worst for the Total Population Completely Vaccinated, There were 18 Democratic states at the top before I got to a Republican state. Then, counting from the bottom, there were 17 Republican states before I got to a Democratic State. I did not count New Hampshire, Arizona, and Pennsylvania as they are neutral states using the measurement system that I created to calculate the political leaning of the states.
Final Conclusions and Thoughts
For three of the four distributions (Total Population, 12+,& 18+), the end count was 34 to 35. For the 65+ distribution, the End count was 10, which is still very significant, but it illustrates that those aged 65+ and over folks know that they are at extreme risk if they get covid, and the vaccine is the secret sauce to keep them alive.
In the images above, you can see four clear and distinct distributions between Republican-leaning states & Democratic-leaning states (Democratic states are taking the shots at a much higher rate).
Also interesting is that Michigan, which has a barely democratic lean, is at the bottom of the democratic states for vaccination rates. But conversely, Wisconsin, which is scarcely republican leaning, is at the top of the Republican states for vaccination rates.
Conclusion
It’s hypothesized that Republican-leaning states are getting their medical advice from Fox News, OAN, and many Republican Politicians. A study by a major website of media habits by state lends support to that claim. The green & red shaded values are the states that are one standard deviation above or below the average. So as you can see, most of the time, it’s a Democratic state that is way above average, and a Republican state is way below average with respect to the Covid-19 vaccination rate. The two exceptions are Nevada and Wisconsin in the 65+ distributions, but it is not as concerning since those vaccine rates are high.
Finally, the data from John Hopkins, & CDC indicate that as the vaccine rates go up, death rates fall, and sadly, low-vaccinated Republican states are paying the price with more deaths.
Infographic – Most Popular News Sites By State
A significant website, semrush.com wanted to find the top news sources that each U.S. state searched for throughout 2020. They mapped out the results in the graphic below. Using Google Trends. They found all 50 states’ popularity scores for each of the 15 most popular news websites. The popularity scores are scaled from 0 to 100, with 100 points assigned to the location where the site’s name comprised the highest proportion of total searches.

By Semrush.com
More Resources On Political News & Thought
Images on this page may contain affiliate links in which we may receive a commission. See our affiliate disclosure for details.
Video: Politics and COVID-19 Vaccinations